Streetsmart Traffic Data Collection and Reporting
Lifetime license – Licensed per sign
One time charge – No Recurring Fees
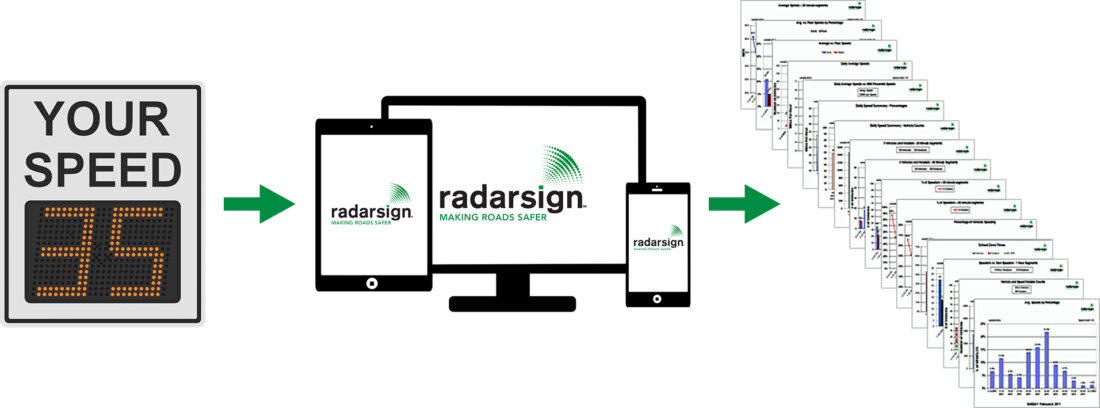
StreetSmart traffic data collection and reporting software allows you to report, organize and analyze the speed and traffic data gathered by the radar speed sign. Program supports MPH and KPH reporting. Generate 35 charts and graphs with Excel™ macro, or from the Radarsign Cloud system. (Cloud not available with TC-400 model)
Each model of our radar speed signs retains data for 12 months before writing over the oldest data first, allowing customers to go back in time for a specific day, week, or month of information.
What Our Customers Have To Say About StreetSmart
Streetsmart Benefits
- Allows the owner to monitor the traffic calming effectiveness of the radar sign on an ongoing basis
- Provides actual data as to how effective the radar speed sign is at reducing speeds, and lowering the percentage of drivers who speed
- Pinpoints specific speeding times during the day, providing law enforcement the best information about when to patrol
- Provides a baseline of the actual speeding problem when traffic speed data is collected with the LED display off (STEALTH mode) and compared with data captured with the LED display on
Computer Requirements
- Windows 10 or newer Operating System (emulation/virtual mode not supported)
- Open USB slot (to transfer files, if not emailed)
- Microsoft Excel 2010 or newer (Mac version not supported)
Standard Reports
(Program supports MPH and KPH reports)
Daily Reports
- Number of vehicles & number of violators:15 minute segments (6 hour view) | 30 minute segments (12 hour view) | 60 minute segments (24 hour view)
- Percentage of speed violators:15 minute segments (6 hour view) | 30 minute segments (12 hour view) | 60 minute segments (24 hour view)
- Average vehicle speeds: 30 minute segments (12 hour view) | 60 minute segments (24 hour view)
- Vehicle counts by speed bins (user selectable), based on average vehicle speeds
- Percentage of vehicles by speed bins (user selectable), based on average vehicle speeds
- Average vs. peak vehicle speeds, by speed bins (user selectable)
- School zone report – # vehicles, # speeders, average speeds, per 30 minute segments
- Speed summary based on percentages (includes % of vehicles speeding > 5 mph | 10 mph | > 15 mph over speed limit, based on average and peak speeds
- Number of vehicles speeding > 5 mph | 10 mph | > 15 mph over speed limit, based on average and peak speeds
Weekly Summary Reports (can be from 2 to 7 days of data):
- Vehicle and speed violator counts
- Daily average speeds
- Daily average speeds vs. daily 85th percentile speeds
- Percentage of vehicles speeding each day
- Vehicle speed counts by speed bins (user selectable), based on peak vehicle speeds
- Vehicle speed counts by speed bins (user selectable), based on average vehicle speeds
- Percentage of vehicles by speed bins (user selectable), average and peak speed comparison
Extended Trend Charts (up to 30 days of data per chart)
- Number of vehicles and number of violators
- Daily speeds (average speeds and peak vehicle speeds)
- Daily average speeds
- Violator trends: > 5 mph | 10 mph | > 15 mph over speed limit (average and peak speeds)
Comparison Charts (can compare from 2 to 7 days of data)
- Daily average speeds
- Percentage change in average daily speeds (assumes one set of data collected in ‘stealth’ mode)
- Percentage of vehicles by speed bins (user selectable), based on peak vehicle speeds
- Percentage of vehicles by speed bins (user selectable), based on average vehicle speeds

Certified Quality System
ISO 9001:2015
ISO 9001:2015

MUTCD Compliant
Radar Speed Signs
Radar Speed Signs

Radarsign is a federally approved contractor in the SAM database
CAGE CODE: 583U5
CAGE CODE: 583U5

Proudly Engineered & Manufactured in the USA